7 Things Radon Gas Risk Maps in England and Wales Show You
Radon risk maps for England and Wales show your postcode's chance of high radon, not one home's reading. What the bands mean and what to check next.
Radon risk maps for England and Wales show the probability that homes in a given postcode or grid square exceed the 200 Bq/m³ action level, based on geology and past measurements. An area is 'affected' where at least 1 in 100 homes is likely to exceed it. They describe the ground's radon potential, not the level in any particular house; only a three-month test shows that.
In this post
- Table of Contents
- What Radon Gas Risk Maps Actually Show
- Where Radon Comes From and Why Some Areas Are Higher
- How to Read a Radon Map by Postcode
- Why a High Radon Potential Does Not Mean a High-Radon Home
- The Health Risk Behind the Radon Action Level
- Radon Testing in Homes: How It Is Measured
- Reducing Radon When a Test Comes Back High
- Where to Find Official Radon Information for a Property
- Frequently Asked Questions
Last Updated: October 25, 2026
Quick Summary
Understanding radon gas risk maps in England and Wales means knowing they show where the ground is likely to release more radon, not a reading from your property. They are built from geology, soil type and past measurements, and the official atlas uses probability bands, with 1 in 100 homes the line for an affected area.
- A radon risk map is a geographic indicator of how much radon a building could accumulate, not a measurement.
- Start with a postcode search, because radon risk changes sharply over short distances.
- The radon action level is 200 becquerels per cubic metre for homes, with a target level of 100.
- Testing uses two detectors left for three months, because levels swing with seasons and weather.
- A high result can be reduced with a sump and fan system, better under-floor ventilation or sealing routes.
Table of Contents
- What Radon Gas Risk Maps Actually Show
- Where Radon Comes From and Why Some Areas Are Higher
- How to Read a Radon Map by Postcode
- Why a High Radon Potential Does Not Mean a High-Radon Home
- The Health Risk Behind the Radon Action Level
- Radon Testing in Homes: How It Is Measured
- Reducing Radon When a Test Comes Back High
- Where to Find Official Radon Information for a Property
- Frequently Asked Questions
What Radon Gas Risk Maps Actually Show
Understanding radon gas risk maps in England and Wales starts with one fact: they do not measure radon. They show where the ground is likely to release more of it.
A radon risk map is a geographic indicator of how much radon a building in a given area could accumulate. It is built from geology, soil type and past measurements, not from a reading taken in your property.
That distinction matters more than any other point. Here at JACKSON, we see buyers treat a map band as a verdict on a house. It is not.
The maps come from the UK Health Security Agency radon guidance, which publishes the official indicative atlas. Below, we explain the seven things those maps really tell you, and the one thing they never can.
Where Radon Comes From and Why Some Areas Are Higher
Radon is a radioactive gas that forms naturally as uranium decays in rock and soil. It rises through the ground and can collect in buildings.
Some geology produces far more of it than others. Granite and certain limestone and shale beds are the usual suspects.
That is why the south-west has long been the most closely watched region, alongside parts of the Midlands and the Pennines. Scotland and Northern Ireland have their own mapping, and their rules differ, so check those separately.
The gas is odourless and invisible. You cannot smell it, see it or taste it. Only a test tells you what is in a building.
How to Read a Radon Map by Postcode
Start with the postcode, not the county. Radon risk changes sharply over short distances, and a postcode-level search is the only useful starting point.
The UKradon postcode search lets you check any address directly. Enter the postcode and it returns the indicative band for that area.
The Bands and What Each One Means
The official atlas uses probability bands. Here is what each one signals:
| Band | What it means | Practical effect |
|---|---|---|
| Affected area | At least 1 in 100 homes likely to exceed the action level | A test is recommended |
| Higher probability | Well above the 1 in 100 threshold | Test before you commit |
| Lower probability | Below the 1 in 100 threshold | Testing still worthwhile |
The 1 in 100 figure is the line the UK Health Security Agency uses to define an affected area. It is a probability, not a promise.
A lower band does not mean zero. It means fewer homes in that area are expected to cross the threshold.
Why a High Radon Potential Does Not Mean a High-Radon Home
This is the part most buyers get wrong. A high band describes the ground, not the building.
Two houses on the same street can read very differently. Construction, floor type, ventilation and how well the building is sealed all change how much gas gathers indoors.
A well-ventilated modern house on a high-band plot may test low. An older, draught-proofed property next door may test high. The map cannot tell them apart.
If you want to see how radon sits alongside flood, crime and planning checks in one place, look at a real sample report to judge the level of detail for yourself.
The Health Risk Behind the Radon Action Level
Radon is the second largest cause of lung cancer after smoking, according to UK Health Security Agency guidance. The risk rises with long-term exposure and with concentration.
The radon action level is 200 becquerels per cubic metre (Bq/m³) for homes. At or above that level, the advice is to act.
There is also a target level of 100 Bq/m³, which is where remediation is worth considering. The lower the reading, the lower the risk, and no reading is risk-free.
Smokers face a much higher combined risk. If anyone in the household smokes, the case for testing is stronger.
This is general information, not medical advice. Speak to a GP about any personal health concern.
Radon Testing in Homes: How It Is Measured
Testing is simple and passive. Two small detectors are placed in the main living room and a bedroom, then left for three months.
Three months matters because radon levels swing with the seasons and the weather. A short test can mislead in either direction.
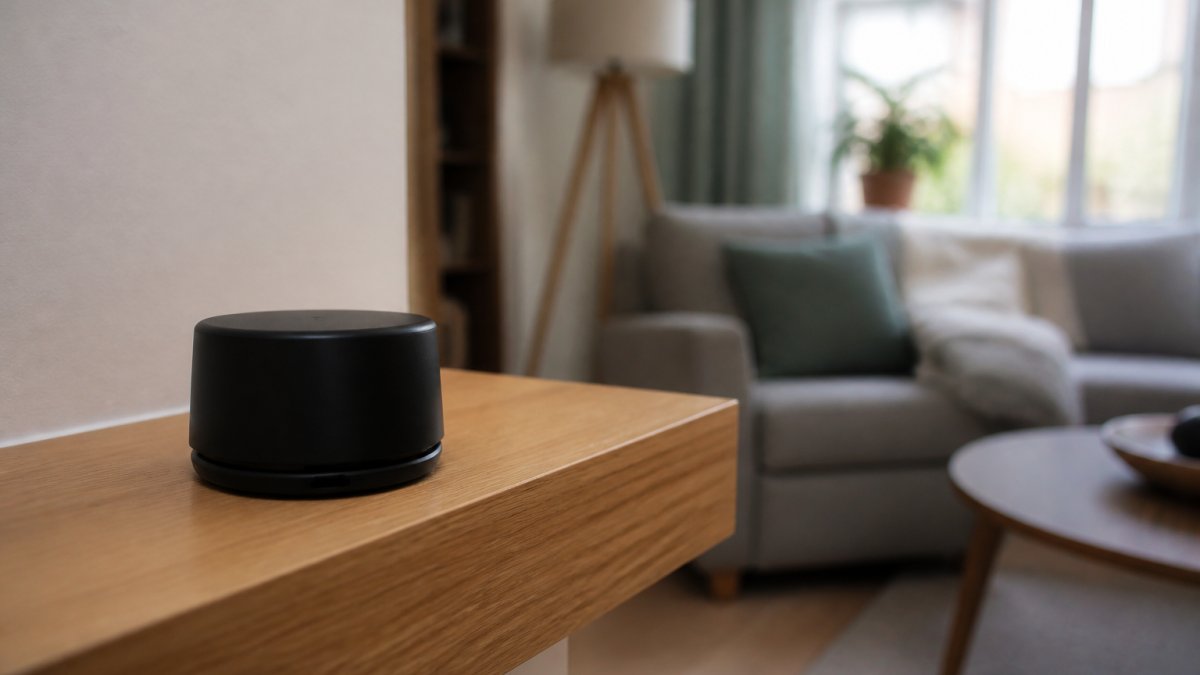
You can order a home test kit through the UKradon testing service. Detectors are posted to you, then returned for analysis.
Watch out: testing in summer only, or for a fortnight, can understate the real level. Follow the full three-month protocol.
Reducing Radon When a Test Comes Back High
A high result is not a dead end. Radon reduction is a well-established trade, and most fixes are straightforward.
The main options:
- Sump and fan system. A small sump under the floor with a fan that draws gas away and vents it above the roof.
- Improved under-floor ventilation. Extra air bricks or a positive ventilation unit to dilute and clear the gas.
- Sealing obvious routes. Gaps, joints and service entries closed to reduce entry points.
Costs vary by property and system, so get quotes from a specialist. Remediation typically brings levels down well below the action level when designed correctly.
If you are weighing up a high result against an offer, our guide to identifying hidden property risks before offer sets radon alongside the other checks worth doing first.
Where to Find Official Radon Information for a Property
Official data sits in a few known places. Use them directly and you will have the official picture for the area.
- The UKradon indicative atlas and postcode search for the band covering an address.
- The local authority environmental health team, which holds records for its area.
- A home test kit for the actual building, which is the only reading that counts.
Our plain-English guides on what to check about an area before you buy cover radon next to flood, crime and planning. If you are deciding whether a paid report is worth it, we give an honest view in is a property risk report worth it.
Radon maps are one environmental dataset among several. If you are comparing map-based risks, our guide to understanding flood risk data follows the same logic.
Frequently Asked Questions
Does a high radon potential mean a home has high radon levels?
No. A radon gas risk map shows the likelihood that a property in that area could have high levels, not what is happening inside one house. Two homes on the same street can differ because of construction, floor type, ventilation and how the building sits on the ground. The only way to know the level in a specific property is radon testing in homes, using detectors placed in the main living room and a bedroom for at least three months.
How do I check radon risk for a postcode?
Use the official UK Health Security Agency radon map, which lets you search by postcode and returns the radon potential band for that area. Read the band as a probability, not a verdict: a higher band means more homes in that area have tested above the radon action level. If you are buying, put the postcode in before you offer, and treat the result as one line of due diligence alongside flood, crime and planning checks.
What should I do if a property is in a higher radon potential area?
Test first. Order detectors and run them for at least three months over the heating season, when levels are usually highest. If the result is at or above the radon action level of 200 becquerels per cubic metre, look at remedial work such as improved under-floor ventilation, a radon sump or a positive input ventilation unit. A qualified radon contractor can advise on the right measure for the building type.
Are radon maps the same for England and Wales?
The official radon map covers both, but the underlying data and the way it is presented have been updated over time, and radon potential varies enormously within each nation. Some of the highest readings in the UK are in the South West of England and parts of Wales. Scotland and Northern Ireland publish their own radon information, so a map for England and Wales will not tell you about a property north of the border.
A radon band tells you what the ground might do, not what the house does. The only way to know is to test, and the only way to judge a whole postcode is to check every dataset together. Jackson's area reports set radon bands alongside flood, crime, noise and planning data in one place; the person-checked Area Report (from £19) is read and signed by a named analyst. Start with the free Viewing Check and see what your postcode really looks like. England & Wales only.

Short on time? Let us run the checks for you
Viewing this weekend and don't fancy an afternoon of maps? The free Foolproof Viewing Check pulls the headline tiles for any address you're looking at — no card, no sign-up.
Want the whole area read by hand and written up, checked and signed off by a real person before it reaches you? That's the Jackson pre-purchase area report. Software does the legwork so it's quick and affordable; a person makes the call so you can trust it. Reports start from £19.
Frequently asked questions
Does a high radon potential mean a home has high radon levels?
No. A radon gas risk map shows the likelihood that a property in that area could have high levels, not what is happening inside one house. Two homes on the same street can differ because of construction, floor type, ventilation and how the building sits on the ground. The only way to know the level in a specific property is radon testing in homes, using detectors placed in the main living room and a bedroom for at least three months.
How do I check radon risk for a postcode?
Use the official UK Health Security Agency radon map, which lets you search by postcode and returns the radon potential band for that area. Read the band as a probability, not a verdict: a higher band means more homes in that area have tested above the radon action level. If you are buying, put the postcode in before you offer, and treat the result as one line of due diligence alongside flood, crime and planning checks.
What should I do if a property is in a higher radon potential area?
Test first. Order detectors and run them for at least three months over the heating season, when levels are usually highest. If the result is at or above the radon action level of 200 becquerels per cubic metre, look at remedial work such as improved under-floor ventilation, a radon sump or a positive input ventilation unit. A qualified radon contractor can advise on the right measure for the building type.
Are radon maps the same for England and Wales?
The official radon map covers both, but the underlying data and the way it is presented have been updated over time, and radon potential varies enormously within each nation. Some of the highest readings in the UK are in the South West of England and parts of Wales. Scotland and Northern Ireland publish their own radon information, so a map for England and Wales will not tell you about a property north of the border.